Monday, 11 November 2013

Moore’s Law, Part 1: Brief history of Moore's Law and current state

This is the first entry of a series focused on Moore’s Law and its implications moving forward, edited from a White paper on Moore’s Law, written by Google University Relations Manager Michel Benard. This series quotes major sources about Moore’s Law and explores how they believe Moore’s Law will likely continue over the course of the next several years. We will also explore if there are fields other than digital electronics that either have an emerging Moore's Law situation, or promises for such a Law that would drive their future performance.


---

Moore's Law is the observation that over the history of computing hardware, the number of transistors on integrated circuits doubles approximately every two years. The period often quoted as "18 months" is due to Intel executive David House, who predicted that period for a doubling in chip performance (being a combination of the effect of more transistors and their being faster). -Wikipedia

Moore’s Law is named after Intel co-founder Gordon E. Moore, who described the trend in his 1965 paper. In it, Moore noted that the number of components in integrated circuits had doubled every year from the invention of the integrated circuit in 1958 until 1965 and predicted that the trend would continue "for at least ten years". Moore’s prediction has proven to be uncannily accurate, in part because the law is now used in the semiconductor industry to guide long-term planning and to set targets for research and development.

The capabilities of many digital electronic devices are strongly linked to Moore's law: processing speed, memory capacity, sensors and even the number and size of pixels in digital cameras. All of these are improving at (roughly) exponential rates as well (see Other formulations and similar laws). This exponential improvement has dramatically enhanced the impact of digital electronics in nearly every segment of the world economy, and is a driving force of technological and social change in the late 20th and early 21st centuries.

Most improvement trends have resulted principally from the industry’s ability to exponentially decrease the minimum feature sizes used to fabricate integrated circuits. Of course, the most frequently cited trend is in integration level, which is usually expressed as Moore’s Law (that is, the number of components per chip doubles roughly every 24 months). The most significant trend is the decreasing cost-per-function, which has led to significant improvements in economic productivity and overall quality of life through proliferation of computers, communication, and other industrial and consumer electronics.

Transistor counts for integrated circuits plotted against their dates of introduction. The curve shows Moore's law - the doubling of transistor counts every two years. The y-axis is logarithmic, so the line corresponds to exponential growth

All of these improvement trends, sometimes called “scaling” trends, have been enabled by large R&D investments. In the last three decades, the growing size of the required investments has motivated industry collaboration and spawned many R&D partnerships, consortia, and other cooperative ventures. To help guide these R&D programs, the Semiconductor Industry Association (SIA) initiated the National Technology Roadmap for Semiconductors (NTRS) in 1992. Since its inception, a basic premise of the NTRS has been that continued scaling of electronics would further reduce the cost per function and promote market growth for integrated circuits. Thus, the Roadmap has been put together in the spirit of a challenge—essentially, “What technical capabilities need to be developed for the industry to stay on Moore’s Law and the other trends?”

In 1998, the SIA was joined by corresponding industry associations in Europe, Japan, Korea, and Taiwan to participate in a 1998 update of the Roadmap and to begin work toward the first International Technology Roadmap for Semiconductors (ITRS), published in 1999. The overall objective of the ITRS is to present industry-wide consensus on the “best current estimate” of the industry’s research and development needs out to a 15-year horizon. As such, it provides a guide to the efforts of companies, universities, governments, and other research providers or funders. The ITRS has improved the quality of R&D investment decisions made at all levels and has helped channel research efforts to areas that most need research breakthroughs.

For more than half a century these scaling trends continued, and sources in 2005 expected it to continue until at least 2015 or 2020. However, the 2010 update to the ITRS has growth slowing at the end of 2013, after which time transistor counts and densities are to double only every three years. Accordingly, since 2007 the ITRS has addressed the concept of functional diversification under the title “More than Moore” (MtM). This concept addresses an emerging category of devices that incorporate functionalities that do not necessarily scale according to “Moore's Law,” but provide additional value to the end customer in different ways.

The MtM approach typically allows for the non-digital functionalities (e.g., RF communication, power control, passive components, sensors, actuators) to migrate from the system board-level into a particular package-level (SiP) or chip-level (SoC) system solution. It is also hoped that by the end of this decade, it will be possible to augment the technology of constructing integrated circuits (CMOS) by introducing new devices that will realize some “beyond CMOS” capabilities. However, since these new devices may not totally replace CMOS functionality, it is anticipated that either chip-level or package level integration with CMOS may be implemented.

The ITRS provides a very comprehensive analysis of the perspective for Moore’s Law when looking towards 2020 and beyond. The analysis can be roughly segmented into two trends: More Moore (MM) and More than Moore (MtM). In the next blog in this series, we will look in the the recent conclusions mentioned in the ITRS 2012 report on both trends.

The opportunities for more discourse on the impact and future of Moore’s Law on CS and other disciplines are abundant, and can be continued with your comments on the Research at Google Google+ page. Please join, and share your thoughts.

Tuesday, 5 November 2013

Improve your website’s performance with the new Speed Suggestions report

Users prefer fast sites. And businesses benefit from it: faster sites tend to have lower bounce rates, increased customer satisfaction and better engagement. Site owners agree, and it shows in their actions taken to optimize site speed: we’re pleased to see from our own benchmarks over the last two years the web is getting faster (not only desktop, even mobile access is around 30% faster compared to last year).

Making your own site faster is something you can act on today and one of the best ways to improve user experience. To help, we’re excited to launch the new Speed Suggestions report in our suite of website performance reports. Not only can you measure and visualize the performance of your website, but you can now also speed up the slowest pages with concrete and actionable suggestions.

Speed Suggestions report


The new Speed Suggestions report shows the average page load time for top visited pages on your website and integrates with the PageSpeed Insights tool to surface suggestions for improving the pages for speed. The PageSpeed Insights tool analyzes the contents of a web page and generates a speed score and concrete suggestions.  The speed score indicates the amount of potential improvement on the page.  The closer the score is to 100, the more optimized the page is for speed.

In the report, you can click through a suggestions link to see a page with all of the suggestions sorted by their impact on site speed. Example suggestions include reducing the amount of content that needs to load before your users can interact with the page, minifying JavaScript, and reducing redirects. Note that if you rewrite your urls before displaying the url in Analytics, or your pages requires a login (see the help article for more details), then the PageSpeed Insights tool may not be able to analyze the page and generate a score and suggestions.


If you would like to dig into the which of your pages take the most time for your users to load, check out the existing Page Timings report which breaks down the average page load time for each page.  Once you’ve identified your slowest pages, you can use the new Speed Suggestions report to improve them. For more general suggestions on how to improve your website, check out these performance articles, and read more about the new report in the detailed help center article.  As always, we welcome feedback on ways to improve the report for our users.

For more help, visit our Google Developers site with tools tips and ideas on making the web faster.

Posted by Chen Xiao, Google Analytics Team

Monday, 4 November 2013

Digital Analytics Association Symposium in San Francisco: End-to-End Data Measurement & Visualization

The annual Digital Analytics Association (DAA) San Francisco Symposium is happening on November 12th  and this year we are happy to host the event at Google’s San Francisco office. The theme this year is end-to-end data measurement and visualization and the DAA SF chapter has lined up industry leaders who will be sharing their experiences. We are expecting a great afternoon of discussion followed by a networking reception. Below are the event details, please join us!

Our lineup of great speakers is focused on presenting real-world solutions to the challenges you face everyday. The lineup includes:
  • Jim Sterne, Target Marketing and the DAA
  • Jon Miller, Co-founder and VP of Marketing at Marketo
  • Michelle Kiss, Partner at Web Analytics Demystified 
  • Joe Megibow, SVP/GM of Omni-Channel eCommerce at American Eagle Outfitters
  • Senior Manager, eCommerce Optimization at Symantec
  • Laura MacTaggert, Director, Web Analysis & Optimization at Salesforce.com
  • and other great speakers
By attending you will:
  • Learn how today's consumer interacts with your brand and how to leverage this interaction data for success
  • Discover how your analytics can drive savvy optimization across multiple channels
  • Uncover how marketing attribution's data output leads to more informed marketing decisions
  • Learn the latest on data visualization from practitioners and vendors 
Theme: End-to-end data measurement and visualization
When: November 12th, registration starts at 12:30, the program goes from 1:00 to to 5:30, followed by a networking reception
Where: Google San Francisco, 345 Spear Street, 6th Floor, San Francisco, CA 94105
Cost: $25 for DAA members/$75 for non-members
Event website and registration: register here.

Space is limited so register early!

Last but not least, this Symposium is organized by local DAA members and volunteers. We encourage you to become a member of the DAA and join our local efforts. Become a member and reach out to one of the local chapter leaders, Krista, Charles or Feras.

Posted by the Google Analytics team

Friday, 1 November 2013

The New Dimensions and Metrics Explorer

To make it easy to navigate all the 270+ data points the Core Reporting API exposes, today we launched version 2 of the Dimensions and Metrics Explorer.

This tool makes it easy to browse all of the dimensions and metrics, identify valid combinations, and get comprehensive definitions and descriptions.


No wonder it’s the third most visited page on the Analytics Developer site.
Today’s update to the tool added:
  • Modes - easily see how API names map to Web View Names, and App View Names.
  • ‘Allowed in Segments’ - Quickly see which data can be used in segments.
  • Updated descriptions- See more details like data type, index ranges, UI names, deprecation status, calculations. For example, see the Custom Variables and Columns group.
  • It’s fast! - No more page loads as you browse and switch between modes.
  • Deep links - Share details of a specific dimension or metric by copying the URL of any view.
  • Automatic Updates - The Metadata API is now used to power the Dimensions and Metrics Explorer. This is a big change and means the tool will automatically update with the latest dimensions and metrics as soon as they’re released.
Visit the Dimensions and Metrics Explorer and tell us what you think.
This tool is built completely using the Metadata API. If you’re thinking about developing your own tools with this data, get started here!
Posted by Pete Frisella, Developer Advocate, Developer Relations Team

Thursday, 31 October 2013

Introducing Mobile App Indexing on Search: a better experience for mobile search users

Here's some great news from Google’s search team: In-app content is now becoming visible in Google search. Starting today, users on Android devices can jump straight from Google search results to pages inside an app.

For Google Analytics for mobile apps users, this opens up a new world of insights into areas like revenues, engagement and overall app usage.

We've reposted the original blog post below. And if you haven't already, try Google Analytics for mobile apps for powerful insights into how users engage with your app.

There are many reasons to build or not to build a mobile app as part of your broader mobile strategy. For instance, while apps offer a rich user experience, users can’t access them through Google Search like they do websites. Today, we’re announcing a new Google Search capability, app indexing, that will start to make apps more accessible through Google on Android.
Let’s say that a user is searching for a movie. With app indexing, Google will begin to include deep links to apps in Android search results. When the user taps on the “Open in app” deep links, the app opens up directly to the movie in question.
In this example, in order for the app deep links to appear in search results,
  • The Flixster app supports deep linking
  • The Rotten Tomatoes website has specified that the Flixster app page is an alternate for the web page
  • Google has indexed the Flixster app to determine relevance
  • The user has installed the Flixster app
The end result is that users will have a seamless search experience when accessing your app content through Google.
Google is currently testing app indexing with an initial group of developers including AllTheCooks, AllTrails, Beautylish, Etsy,Expedia, Flixster, Healthtap, IMDb, moviefone, newegg, OpenTable, Trulia, and Wikipedia. Deep links for these applications will start to appear in Google search results on Android, in the US, in a few weeks.

How to get started

If you are interested in enabling indexing for your Android app, you can learn more about our developer guidelines at developers.google.com/app-indexing and sign up. We are expanding our app indexing efforts and will gradually include more developers over time.
Posted by Chaesang Jung, Software Engineer

Wednesday, 30 October 2013

Measuring Twitter with Universal Analytics

In between rolling out new features for Google Analytics, we also like to feature how users and companies are actually using our products. Matt Stannard of 4PS Marketing details how to easily monitor Twitter and see number of tweets, active users, and hashtags for a topic using Universal Analytics. We’ve excerpted parts of his post below, read on to see the results, and don’t forget to click through to see the technical details!

How?

Step 1 - Create a new account
First, we need to create a new account, which is accomplished easily through the new look and feel of Analytics. Remember this is under Admin and then in the Account drop down. I made a new Universal Analytics account for my particular experiment - you then need to note the UA number.

Step 2 - Install PHP / MySQL
I downloaded a WAMP stack called XAMPP as I wanted to use PHP as my Twitter monitoring library. XAMPP includes Apache, PHP and MySQL. You can use any tool of your choose provided you are able to edit the code and add the necessary Measurement Protocol requests. The library I used is was from 140Dev.

Step 3 - Create Twitter Application
In order to use the PHP monitoring library you need to have a Twitter Application. You can create this by signing in at https://dev.twitter.com/. Click My Applications:


Create your application and after you've done this you will need to note the Consumer Key, Consumer Secret, Access Token, Access Token Secret. 


Step 4 - Start Monitoring
So, now we've got our Twitter application we can begin monitoring, in the 140dev package you need to modify a few files, firstly the db_config.php. You can find the code here, on the original blog post.

Results
The reporting interface of Google Analytics is actually very effective at monitoring Twitter as you are able to look in Real Time, use Dashboards, or custom reports.

The Real Time Analytics is fantastic at showing how active the things your are monitoring on Twitter is. If you just look at the Real Time overview as this screenshot shows:

(click image for full-sized version)

You can use Dashboards to report on key areas of interest and apply whatever filtering you need, the dashboard below just shows the key hashtags, users, users mentioned and urls shared: 

(click image for full-sized version)
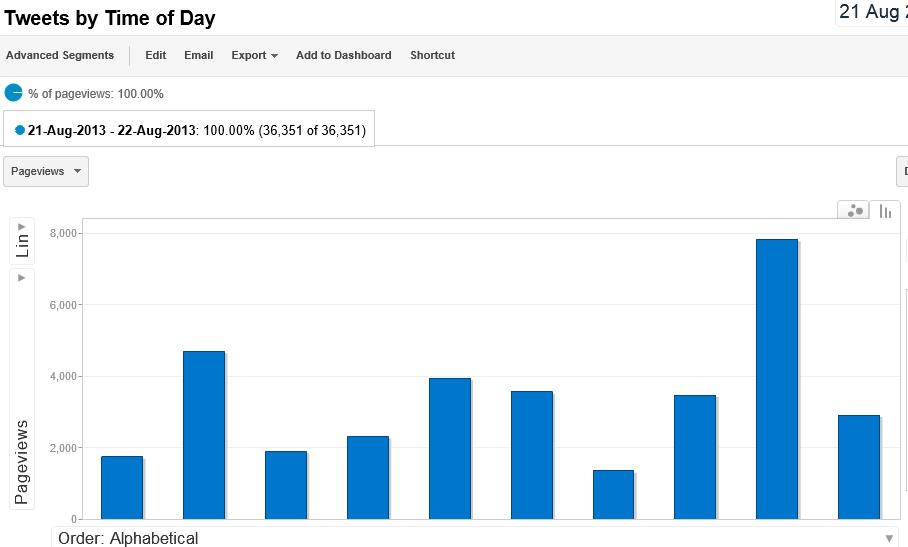
Custom Reporting also allows us to produce charts such as what times of the day users were active:

(click image for full-sized version)

The full post can be found here.

Posted by Aditi Rajaram, Google Analytics Team

Monday, 28 October 2013

New AdSense Data in the Core Reporting API

Google AdSense is a free, simple way for website publishers to earn money by displaying targeted Google ads on their websites. Today, we’ve added the ability to access AdSense data from the Google Analytics Core Reporting API. The AdSense and Analytics integration allows publishers to gain richer data and insights, leading to better optimized ad space and a higher return on investment.

In the past, accessing AdSense data using the Analytics Core Reporting API has been a top feature request. We’ve now added 8 new AdSense metrics to the Analytics Core Reporting API, enabling publishers to streamline their analysis.

Answering Business Questions
You can now answer the following business questions using these API queries:

Which pages on your site contribute most to your AdSense revenue?

dimensions=ga:pagePath
&metrics=ga:adsenseCTR,ga:adsenseRevenue,ga:adsenseECPM &sort=-ga:adsenseRevenue

Which pages generate a high number of pageviews but aren't monetizing as well as other pages?

dimensions=ga:pagePath
&metrics=ga:pageviews,ga:adsenseCTR
&sort=-ga:pageviews

Which traffic sources contribute to your revenue?
dimensions=ga:sourceMedium
&metrics=ga:adsenseCTR,ga:adsenseRevenue,ga:adsenseECPM
&sort=-ga:adsenseRevenue

Reporting Automation
By accessing this data through the API, you can now automate reporting and spend more time doing analysis. You can also use the API to integrate data from multiple sites into a single dashboard, build corporate dashboards to share across the team, and use the API to integrate data into CRM tools that display AdSense Ads.

Getting Started
To learn more about the new AdSense data, take a look at our Google Analytics Dimensions and Metrics Explorer. You can also test the API with your data by building queries in the Google Analytics Query Explorer.

Busy? In that case, now’s a great time to try these Analytics API productivity tools:
  • Magic Script: A Google Spreadsheets script to automate importing Analytics data into Spreadsheets, allowing for easy data manipulation. No coding required!
  • Google Analytics superProxy: An App Engine application that reduces all the complexity of authorization.

We hope this new data will be useful, and we're looking forward to seeing what new reports developers build.

Posted by Nick Mihailovksi, Product Manager, Google Analytics API Team